SmogRank / Episodes / Germany
Germany and France, January 2026
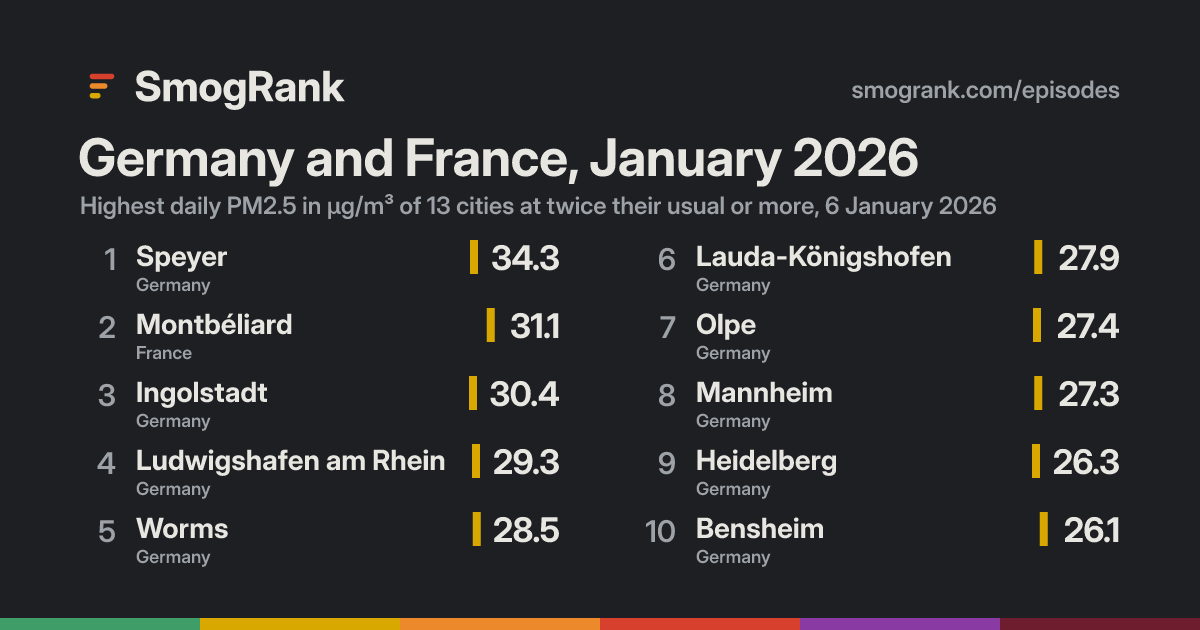
For 1 day, on 6 January 2026, 13 cities in Germany and France had PM2.5 at least twice their usual for the time of year. The worst reading was Speyer, Rheinland-Pfalz, Germany: 34.3 µg/m³ on 6 January, about 3.0× its usual 11.6.
No cause named We have no fire or smoke records for these days, so we only say what the measurements show.
Cities reached 13 in 2 countries
Days 1 6 January 2026
Worst day 6 January 13 cities counted
Furthest above usual 3.0× Speyer
Day by day
Play 6 January 13 cities at twice their usual or more
Tübingen Herrenberg Reutlingen Filderstadt Villingen-Schwenningen Stuttgart Pforzheim Ludwigsburg Baden-Baden Karlsruhe Heilbronn Winterthur Eggenstein-Leopoldshafen Friedrichshafen Biberach an der Riß Zürich Ulm Neu-Ulm Freiburg Kehl Lindau Schwäbisch Hall Strasbourg Aalen Michelstadt Müllheim Lörrach Riedstadt Kempten (Allgäu) Darmstadt Basel Kaiserslautern Großostheim Aschaffenburg Mulhouse Rüsselsheim am Main Mainz Hattersheim Frankfurt am Main Würzburg Hanau am Main Bad Kreuznach Eschborn Wiesbaden Königstein im Taunus Ansbach Augsburg Bern Saarbrücken Bellinzona Limburg an der Lahn Völklingen Wetzlar Gießen Wadgassen Saint-Avold Fulda Lugano Dillingen Koblenz Lunéville Nuremberg Épinal Bendorf Marburg an der Lahn Starnberg Bamberg Neuwied Trier Munich Meiningen Netphen Innsbruck Nancy Bad Wildungen Metz Suhl Thionville Eisenach Bonn Kassel Kelheim Luxembourg Witzenhausen Lüdenscheid Esch-sur-Alzette Warstein Köln Mühlhausen Landshut Leverkusen Hagen Schwandorf in Bayern Schwerte Erfurt Pulheim Wuppertal Annemasse Hattingen Weiden Düsseldorf Weimar Marktredwitz Ratingen Sondershausen Jülich Essen Jüchen Eupen Traunreut Jena Aachen Duisburg Mönchengladbach Krefeld Heerlen Burghausen Nettetal Saint-Dizier Greiz Marche-en-Famenne Liège Saalfelden am Steinernen Meer Gera Venlo Chambéry Ans Flémalle-Haute Salzburg Weißenfels Zeitz Bourg-en-Bresse Genk Merseburg Andenne Hasselt Altenburg Houthalen Namur Eindhoven Villefontaine Meyzieu Mol Villefranche-sur-Saône Lyon Aarschot Charleroi Jumet Reims Rixensart Zaventem Wels Mechelen Brussels Beersel Grimbergen Willebroek Gorizia Traun Antwerp Kapellen Auxerre Saint-Étienne Linz Mons Ansfelden Zwijndrecht Stabroek Beveren Steyr Koper Klagenfurt am Wörthersee Stodůlky Valenciennes Lochristi Prague Saint-Quentin Coulommiers Kranj Gent Moulins Denain Evergem Nevers Vichy Tournai Amstetten Říčany Ljubljana Wolfsberg Kortrijk Maldegem Douai Roubaix Izegem Menen Lille Roeselare Clermont-Ferrand Knokke-Heist Lampertheim Olpe Worms Montbéliard Albertville Mannheim Ingolstadt Bensheim Wiesloch Lauda-Königshofen Ludwigshafen am Rhein Heidelberg Speyer 3 Jan 4 5 6 7 8 9 Every measured city in the area, coloured by its PM2.5 that day; a dark ring marks a city at twice its usual or more. Bars: cities counted each day, coloured by their median level. Choose a day or press play; without JavaScript, the days link to that day's world ranking.
How it spread
Speyer Speyer, 3 January: 9.2 µg/m³ Speyer, 4 January: 9.1 µg/m³ Speyer, 5 January: 21.2 µg/m³ Speyer, 6 January: 34.3 µg/m³, 3.0× its usual 11.6 Speyer, 7 January: no reading Speyer, 8 January: no reading Speyer, 9 January: no reading Montbéliard Montbéliard, 3 January: 7.1 µg/m³ Montbéliard, 4 January: 10.4 µg/m³ Montbéliard, 5 January: 28.0 µg/m³ Montbéliard, 6 January: 31.1 µg/m³, 2.2× its usual 14.1 Montbéliard, 7 January: no reading Montbéliard, 8 January: no reading Montbéliard, 9 January: no reading Ingolstadt Ingolstadt, 3 January: 5.3 µg/m³ Ingolstadt, 4 January: 10.6 µg/m³ Ingolstadt, 5 January: 28.9 µg/m³ Ingolstadt, 6 January: 30.4 µg/m³, 2.3× its usual 13.3 Ingolstadt, 7 January: no reading Ingolstadt, 8 January: no reading Ingolstadt, 9 January: 6.4 µg/m³ Ludwigshafen am Rhe… Ludwigshafen am Rhein, 3 January: 8.1 µg/m³ Ludwigshafen am Rhein, 4 January: 8.6 µg/m³ Ludwigshafen am Rhein, 5 January: 16.7 µg/m³ Ludwigshafen am Rhein, 6 January: 29.3 µg/m³, 2.7× its usual 11.0 Ludwigshafen am Rhein, 7 January: no reading Ludwigshafen am Rhein, 8 January: no reading Ludwigshafen am Rhein, 9 January: 3.1 µg/m³ Worms Worms, 3 January: 10.5 µg/m³ Worms, 4 January: 9.6 µg/m³ Worms, 5 January: 18.1 µg/m³ Worms, 6 January: 28.5 µg/m³, 2.2× its usual 13.1 Worms, 7 January: no reading Worms, 8 January: no reading Worms, 9 January: 3.5 µg/m³ Lauda-Königshofen Lauda-Königshofen, 3 January: 7.0 µg/m³ Lauda-Königshofen, 4 January: 8.9 µg/m³ Lauda-Königshofen, 5 January: 15.0 µg/m³ Lauda-Königshofen, 6 January: 27.9 µg/m³, 2.7× its usual 10.5 Lauda-Königshofen, 7 January: no reading Lauda-Königshofen, 8 January: no reading Lauda-Königshofen, 9 January: 7.0 µg/m³ Olpe Olpe, 3 January: 8.2 µg/m³ Olpe, 4 January: 8.0 µg/m³ Olpe, 5 January: 16.4 µg/m³ Olpe, 6 January: 27.4 µg/m³, 2.2× its usual 12.4 Olpe, 7 January: 9.8 µg/m³ Olpe, 8 January: 9.7 µg/m³ Olpe, 9 January: 0.7 µg/m³ Mannheim Mannheim, 3 January: 10.4 µg/m³ Mannheim, 4 January: 11.2 µg/m³ Mannheim, 5 January: 16.7 µg/m³ Mannheim, 6 January: 27.3 µg/m³, 2.3× its usual 11.9 Mannheim, 7 January: no reading Mannheim, 8 January: no reading Mannheim, 9 January: 3.8 µg/m³ Heidelberg Heidelberg, 3 January: 8.4 µg/m³ Heidelberg, 4 January: 9.3 µg/m³ Heidelberg, 5 January: 15.6 µg/m³ Heidelberg, 6 January: 26.3 µg/m³, 2.9× its usual 9.2 Heidelberg, 7 January: no reading Heidelberg, 8 January: no reading Heidelberg, 9 January: no reading Bensheim Bensheim, 3 January: 9.1 µg/m³ Bensheim, 4 January: 11.0 µg/m³ Bensheim, 5 January: 17.2 µg/m³ Bensheim, 6 January: 26.1 µg/m³, 2.4× its usual 10.8 Bensheim, 7 January: no reading Bensheim, 8 January: no reading Bensheim, 9 January: 1.9 µg/m³ Albertville Albertville, 3 January: 18.0 µg/m³ Albertville, 4 January: 13.0 µg/m³ Albertville, 5 January: 19.5 µg/m³ Albertville, 6 January: 25.2 µg/m³, 2.3× its usual 11.2 Albertville, 7 January: no reading Albertville, 8 January: no reading Albertville, 9 January: no reading Lampertheim Lampertheim, 3 January: 8.4 µg/m³ Lampertheim, 4 January: 8.7 µg/m³ Lampertheim, 5 January: 16.0 µg/m³ Lampertheim, 6 January: 25.1 µg/m³, 2.2× its usual 11.5 Lampertheim, 7 January: no reading Lampertheim, 8 January: no reading Lampertheim, 9 January: no reading Wiesloch Wiesloch, 3 January: 7.7 µg/m³ Wiesloch, 4 January: 9.9 µg/m³ Wiesloch, 5 January: 17.8 µg/m³ Wiesloch, 6 January: 25.0 µg/m³, 2.6× its usual 9.6 Wiesloch, 7 January: no reading Wiesloch, 8 January: no reading Wiesloch, 9 January: 3.9 µg/m³ 3 Jan 4 5 6 7 8 9 Every counted city, in the order the episode reached them, 3 days before to 3 after. Each square is a day, coloured by that day's PM2.5; outlined: at twice the city's usual or more. Good 0–50
Moderate 51–100
Sensitive groups 101–150
Unhealthy 151–200
Very unhealthy 201–300
Hazardous 301+
Every city it reached
City Days Highest Usual Above usual
Speyer Rheinland-Pfalz, Germany 1 6 January 11.6 3.0× Heidelberg Baden-Wurttemberg, Germany 1 6 January 9.2 2.9× Ludwigshafen am Rhein Rheinland-Pfalz, Germany 1 6 January 11.0 2.7× Lauda-Königshofen Baden-Wurttemberg, Germany 1 6 January 10.5 2.7× Wiesloch Baden-Wurttemberg, Germany 1 6 January 9.6 2.6× Bensheim Hesse, Germany 1 6 January 10.8 2.4× Ingolstadt Bavaria, Germany 1 6 January 13.3 2.3× Mannheim Baden-Wurttemberg, Germany 1 6 January 11.9 2.3× Albertville Auvergne-Rhône-Alpes, France 1 6 January 11.2 2.3× Montbéliard Bourgogne-Franche-Comté, France 1 6 January 14.1 2.2× Worms Rheinland-Pfalz, Germany 1 6 January 13.1 2.2× Olpe North Rhine-Westphalia, Germany 1 6 January 12.4 2.2× Lampertheim Hesse, Germany 1 6 January 11.5 2.2×
Daily means in µg/m³, over the days each city counted in this episode. Highest: its highest of those days. Usual: the city's median for the time of year of that day (its days within 21 days of the date, every year, leaving out the week around it). Above usual: its highest day against that, with a usual under 5 µg/m³ taken as 5.
Against other episodes in Germany and France
Number 43 of 54 episodes in Germany and France since our records began, by cities reached.
Europe, 6 to 25 February 2023 608 Europe, 14 February to 1 March 2025 517 Europe, 1 to 14 February 2025 506 Europe, January and February 2026 502 Germany, Poland and 25 more countries, March 2025 463 Europe, 8 to 27 January 2024 449 Europe, 1 to 12 March 2026 444 Germany, France and 18 more countries, January 2025 381 Europe, 18 to 25 March 2026 362 Europe, March 2025 335 Europe, 28 February to 4 March 2023 279 Europe, February and March 2024 264 Germany and France, January 2026 13 Bars: cities reached; colour: the level of the episode's highest daily reading. All 54 .
Use this page SmogRank, Germany and France, January 2026: 13 cities with PM2.5 at twice their usual or more, 6 January 2026, smogrank.com/episodes/2026-01-germany-and-france (accessed 4 October 2026).
Copy citation Download top 10 (PNG)
You're welcome to reuse a single chart, image or figure with this citation and a link. Terms .
An episode is a run of days when many cities close to each other (four or more within 350 km on a day, 8 or more in all) each had a daily PM2.5 mean of at least 25 µg/m³ and at least 2 times their usual for that time of year. Found in our own measurements, not picked by hand. How we find episodes . Values are each city's daily mean of its own monitors; causes are the usual kinds for a pattern like this, not a confirmed source.