SmogRank / Episodes / United States
North-western United States, October and November 2023
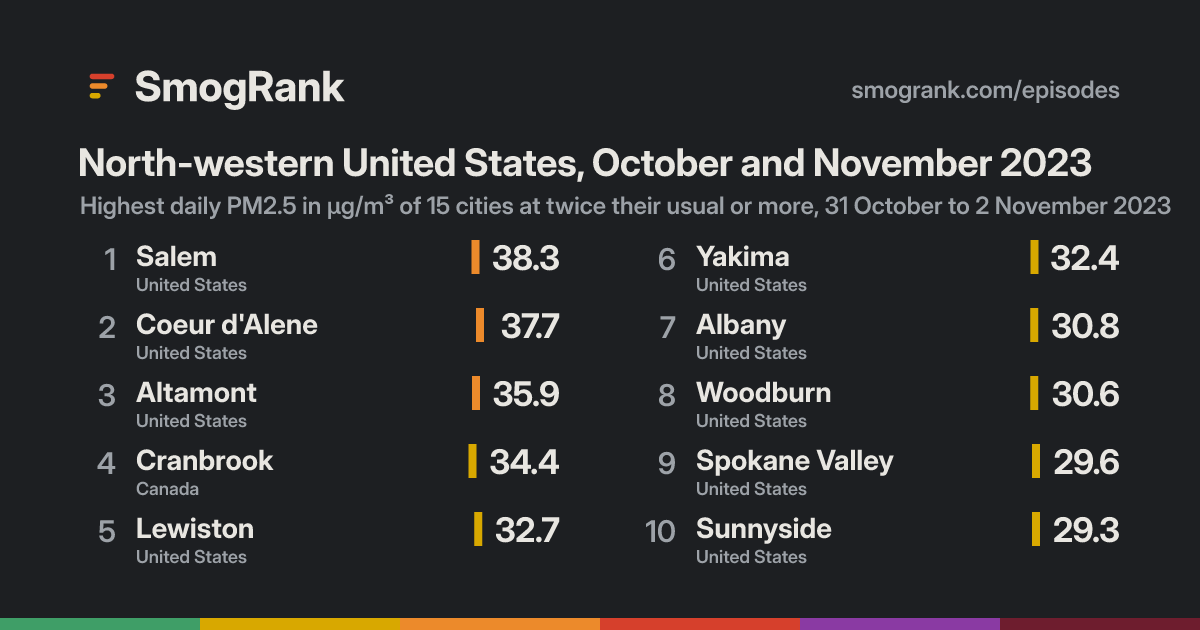
For 3 days, from 31 October to 2 November 2023, 15 cities in the United States and Canada had PM2.5 at least twice their usual for the time of year. The worst reading was Salem, Oregon, United States: 38.3 µg/m³ on 1 November, about 5.6× its usual 6.9.
No cause named We have no fire or smoke records for these days, so we only say what the measurements show.
Cities reached 15 in 2 countries
Days 3 31 October to 2 November 2023
Worst day 1 November 11 cities counted
Furthest above usual 5.6× Salem
Day by day
Play 1 November 11 cities at twice their usual or more
Tri-Cities Pasco Pendleton Walla Walla Moses Lake Ellensburg The Dalles Wenatchee Redmond Pullman Bend Moscow Gresham Issaquah Orchards Auburn Salmon Creek Milwaukie Vancouver Renton Portland Bellevue Canby Tacoma Columbia City Tigard Beaverton Seattle Shoreline Longview Marysville Hillsboro Lacey Centralia Bremerton Forest Grove Penticton McMinnville Mount Vernon Meridian Corvallis Oak Harbor Eugene Boise Kelowna Anacortes Chilliwack Bellingham Abbotsford Aberdeen Port Angeles Langley Victoria Roseburg Strawberry Hill Port Coquitlam Coquitlam Langford Delta Burnaby Ashland Medford Richmond Vancouver North Vancouver West Vancouver Duncan Grants Pass North Cowichan Squamish Coos Bay Harewood Nanaimo Missoula Twin Falls Port Alberni Courtenay Campbell River Yakima Spokane Altamont Lewiston Sunnyside Spokane Valley Albany Nampa Cranbrook Woodburn Hermiston Dallas Parkland Coeur d'Alene Salem 28 Oct 29 30 31 1 Nov 2 3 4 5 Every measured city in the area, coloured by its PM2.5 that day; a dark ring marks a city at twice its usual or more. Bars: cities counted each day, coloured by their median level. Choose a day or press play; without JavaScript, the days link to that day's world ranking.
How it spread
Cranbrook Cranbrook, 28 October: 25.6 µg/m³, 3.5× usual Cranbrook, 29 October: 27.3 µg/m³, 3.7× usual Cranbrook, 30 October: 24.9 µg/m³, 3.4× usual Cranbrook, 31 October: 29.2 µg/m³, 3.9× usual Cranbrook, 1 November: 29.4 µg/m³, 4.0× usual Cranbrook, 2 November: 34.4 µg/m³, 4.6× usual Cranbrook, 3 November: 13.0 µg/m³, 1.8× usual Cranbrook, 4 November: 17.1 µg/m³, 2.3× usual Cranbrook, 5 November: 8.2 µg/m³, 1.1× usual Salem Salem, 28 October: 8.3 µg/m³, 1.2× usual Salem, 29 October: 11.2 µg/m³, 1.6× usual Salem, 30 October: 16.3 µg/m³, 2.4× usual Salem, 31 October: 34.0 µg/m³, 4.9× usual Salem, 1 November: 38.3 µg/m³, 5.6× usual Salem, 2 November: 7.6 µg/m³, 1.1× usual Salem, 3 November: 18.1 µg/m³, 2.6× usual Salem, 4 November: 4.8 µg/m³, 0.7× usual Salem, 5 November: 4.2 µg/m³, 0.6× usual Albany Albany, 28 October: 7.2 µg/m³, 1.0× usual Albany, 29 October: 12.3 µg/m³, 1.7× usual Albany, 30 October: 20.0 µg/m³, 2.7× usual Albany, 31 October: 30.8 µg/m³, 4.2× usual Albany, 1 November: 22.9 µg/m³, 3.1× usual Albany, 2 November: 7.9 µg/m³, 1.1× usual Albany, 3 November: 13.4 µg/m³, 1.8× usual Albany, 4 November: 3.9 µg/m³, 0.5× usual Albany, 5 November: 4.4 µg/m³, 0.6× usual Woodburn Woodburn, 28 October: 6.4 µg/m³, 1.0× usual Woodburn, 29 October: 10.3 µg/m³, 1.6× usual Woodburn, 30 October: 12.2 µg/m³, 1.9× usual Woodburn, 31 October: 30.6 µg/m³, 4.7× usual Woodburn, 1 November: 28.9 µg/m³, 4.4× usual Woodburn, 2 November: 7.4 µg/m³, 1.1× usual Woodburn, 3 November: 12.4 µg/m³, 1.9× usual Woodburn, 4 November: 4.2 µg/m³, 0.6× usual Woodburn, 5 November: 4.1 µg/m³, 0.6× usual Parkland Parkland, 28 October: 12.5 µg/m³, 2.3× usual Parkland, 29 October: 22.0 µg/m³, 4.1× usual Parkland, 30 October: 22.2 µg/m³, 4.1× usual Parkland, 31 October: 28.3 µg/m³, 5.2× usual Parkland, 1 November: 24.7 µg/m³, 4.6× usual Parkland, 2 November: 4.1 µg/m³, 0.8× usual Parkland, 3 November: 6.0 µg/m³, 1.1× usual Parkland, 4 November: no reading Parkland, 5 November: no reading Dallas Dallas, 28 October: 6.9 µg/m³, 1.4× usual Dallas, 29 October: 7.0 µg/m³, 1.4× usual Dallas, 30 October: 20.2 µg/m³, 4.0× usual Dallas, 31 October: 25.7 µg/m³, 5.1× usual Dallas, 1 November: 22.8 µg/m³, 4.6× usual Dallas, 2 November: 4.9 µg/m³, 1.0× usual Dallas, 3 November: 12.3 µg/m³, 2.5× usual Dallas, 4 November: 5.0 µg/m³, 1.0× usual Dallas, 5 November: 3.8 µg/m³, 0.8× usual Lewiston Lewiston, 28 October: 17.2 µg/m³, 2.0× usual Lewiston, 29 October: 16.5 µg/m³, 1.9× usual Lewiston, 30 October: 14.7 µg/m³, 1.7× usual Lewiston, 31 October: 22.8 µg/m³, 2.7× usual Lewiston, 1 November: 32.7 µg/m³, 3.8× usual Lewiston, 2 November: 11.2 µg/m³, 1.3× usual Lewiston, 3 November: 12.1 µg/m³, 1.4× usual Lewiston, 4 November: 10.1 µg/m³, 1.2× usual Lewiston, 5 November: 9.8 µg/m³, 1.1× usual Altamont Altamont, 28 October: 10.0 µg/m³, 1.2× usual Altamont, 29 October: 17.8 µg/m³, 2.2× usual Altamont, 30 October: 18.8 µg/m³, 2.3× usual Altamont, 31 October: 16.5 µg/m³, 2.0× usual Altamont, 1 November: 31.5 µg/m³, 3.8× usual Altamont, 2 November: 35.9 µg/m³, 4.4× usual Altamont, 3 November: 17.6 µg/m³, 2.1× usual Altamont, 4 November: 10.4 µg/m³, 1.3× usual Altamont, 5 November: 5.0 µg/m³, 0.6× usual Coeur d'Alene Coeur d'Alene, 28 October: 21.0 µg/m³, 3.0× usual Coeur d'Alene, 29 October: 20.3 µg/m³, 2.9× usual Coeur d'Alene, 30 October: 17.7 µg/m³, 2.5× usual Coeur d'Alene, 31 October: 18.8 µg/m³, 2.7× usual Coeur d'Alene, 1 November: 28.9 µg/m³, 4.1× usual Coeur d'Alene, 2 November: 37.7 µg/m³, 5.4× usual Coeur d'Alene, 3 November: 14.5 µg/m³, 2.1× usual Coeur d'Alene, 4 November: no reading Coeur d'Alene, 5 November: no reading Yakima Yakima, 28 October: 10.9 µg/m³, 1.2× usual Yakima, 29 October: 16.1 µg/m³, 1.8× usual Yakima, 30 October: 19.2 µg/m³, 2.1× usual Yakima, 31 October: 21.1 µg/m³, 2.3× usual Yakima, 1 November: 28.8 µg/m³, 3.2× usual Yakima, 2 November: 32.4 µg/m³, 3.6× usual Yakima, 3 November: 20.6 µg/m³, 2.3× usual Yakima, 4 November: 12.9 µg/m³, 1.4× usual Yakima, 5 November: 9.6 µg/m³, 1.1× usual Hermiston Hermiston, 28 October: 11.3 µg/m³, 2.1× usual Hermiston, 29 October: 13.8 µg/m³, 2.6× usual Hermiston, 30 October: 17.7 µg/m³, 3.3× usual Hermiston, 31 October: 20.7 µg/m³, 3.8× usual Hermiston, 1 November: 27.6 µg/m³, 5.1× usual Hermiston, 2 November: 27.6 µg/m³, 5.1× usual Hermiston, 3 November: 9.4 µg/m³, 1.7× usual Hermiston, 4 November: 15.4 µg/m³, 2.9× usual Hermiston, 5 November: 2.8 µg/m³, 0.5× usual Spokane Spokane, 28 October: 19.0 µg/m³, 2.8× usual Spokane, 29 October: 23.5 µg/m³, 3.4× usual Spokane, 30 October: 22.3 µg/m³, 3.2× usual Spokane, 31 October: 20.6 µg/m³, 3.0× usual Spokane, 1 November: 26.2 µg/m³, 3.8× usual Spokane, 2 November: 24.8 µg/m³, 3.6× usual Spokane, 3 November: 12.9 µg/m³, 1.9× usual Spokane, 4 November: 11.1 µg/m³, 1.6× usual Spokane, 5 November: 5.0 µg/m³, 0.7× usual Sunnyside Sunnyside, 28 October: 10.3 µg/m³, 1.4× usual Sunnyside, 29 October: 17.6 µg/m³, 2.4× usual Sunnyside, 30 October: 20.1 µg/m³, 2.7× usual Sunnyside, 31 October: 18.7 µg/m³, 2.5× usual Sunnyside, 1 November: 25.5 µg/m³, 3.4× usual Sunnyside, 2 November: 29.3 µg/m³, 4.0× usual Sunnyside, 3 November: 18.2 µg/m³, 2.5× usual Sunnyside, 4 November: 15.4 µg/m³, 2.1× usual Sunnyside, 5 November: 7.1 µg/m³, 1.0× usual Spokane Valley Spokane Valley, 28 October: 20.7 µg/m³, 2.9× usual Spokane Valley, 29 October: 22.0 µg/m³, 3.1× usual Spokane Valley, 30 October: 18.8 µg/m³, 2.6× usual Spokane Valley, 31 October: 20.6 µg/m³, 2.9× usual Spokane Valley, 1 November: 25.0 µg/m³, 3.5× usual Spokane Valley, 2 November: 29.6 µg/m³, 4.2× usual Spokane Valley, 3 November: 10.8 µg/m³, 1.5× usual Spokane Valley, 4 November: 10.8 µg/m³, 1.5× usual Spokane Valley, 5 November: 5.3 µg/m³, 0.7× usual Nampa Nampa, 28 October: 9.7 µg/m³, 1.5× usual Nampa, 29 October: 10.7 µg/m³, 1.6× usual Nampa, 30 October: 11.9 µg/m³, 1.8× usual Nampa, 31 October: 11.8 µg/m³, 1.8× usual Nampa, 1 November: 21.8 µg/m³, 3.4× usual Nampa, 2 November: 28.1 µg/m³, 4.3× usual Nampa, 3 November: 23.6 µg/m³, 3.6× usual Nampa, 4 November: no reading Nampa, 5 November: no reading 28 Oct 29 30 31 1 Nov 2 3 4 5 Every counted city, in the order the episode reached them, 3 days before to 3 after. Each square is a day, coloured by that day's PM2.5; outlined: at twice the city's usual or more. Good 0–50
Moderate 51–100
Sensitive groups 101–150
Unhealthy 151–200
Very unhealthy 201–300
Hazardous 301+
Every city it reached
City Days Highest Usual Above usual
Salem Oregon, United States 2 1 November 6.9 5.6× Coeur d'Alene Idaho, United States 2 2 November 7.0 5.4× Parkland Washington, United States 1 31 October 5.4 5.2× Dallas Oregon, United States 1 31 October 4.5 5.1× Hermiston Oregon, United States 2 1 November 5.4 5.1× Woodburn Oregon, United States 2 31 October 6.5 4.7× Cranbrook British Columbia, Canada 2 2 November 7.4 4.6× Altamont Oregon, United States 1 2 November 8.2 4.4× Nampa Idaho, United States 1 2 November 6.5 4.3× Spokane Valley Washington, United States 2 2 November 7.1 4.2× Albany Oregon, United States 1 31 October 7.4 4.2× Sunnyside Washington, United States 2 2 November 7.4 4.0× Lewiston Idaho, United States 1 1 November 8.6 3.8× Spokane Washington, United States 1 1 November 6.9 3.8× Yakima Washington, United States 2 2 November 9.0 3.6×
Daily means in µg/m³. Usual: the city's median for this time of year (its days within 21 days of the date, every year, leaving out the week around it). Above usual: its highest day against that.
Against other episodes in the United States and Canada
Number 27 of 45 episodes in the United States and Canada since our records began, by cities reached.
North-eastern United States and Canada, June and July 2023 279 North-eastern United States and Canada, May and June 2023 260 North-eastern United States and Canada, July 2023 241 North-eastern United States and Canada, June 2023 161 North-western United States and Canada, August 2023 110 North-eastern United States and Canada, July 2023 75 Western United States, September 2023 61 South-eastern United States, October 2023 47 North-eastern United States, July 2023 46 North-western United States and Canada, May 2023 42 Western United States, December 2023 32 Northern United States, January 2023 32 North-western United States, October and November 2023 15 Bars: cities reached; colour: the level of the episode's highest daily reading. All 45 .
Use this page SmogRank, North-western United States, October and November 2023: 15 cities with PM2.5 at twice their usual or more, 31 October to 2 November 2023, smogrank.com/episodes/2023-10-north-western-united-states (accessed 2 October 2026).
Copy citation Download top 10 (PNG)
You're welcome to reuse a single chart, image or figure with this citation and a link. Terms .
An episode is a run of days when many cities close to each other (four or more within 350 km on a day, 8 or more in all) each had a daily PM2.5 mean of at least 25 µg/m³ and at least 2 times their usual for that time of year. Found in our own measurements, not picked by hand. How we find episodes . Values are each city's daily mean of its own monitors; causes are the usual kinds for a pattern like this, not a confirmed source.