Poland and Germany, January 2026
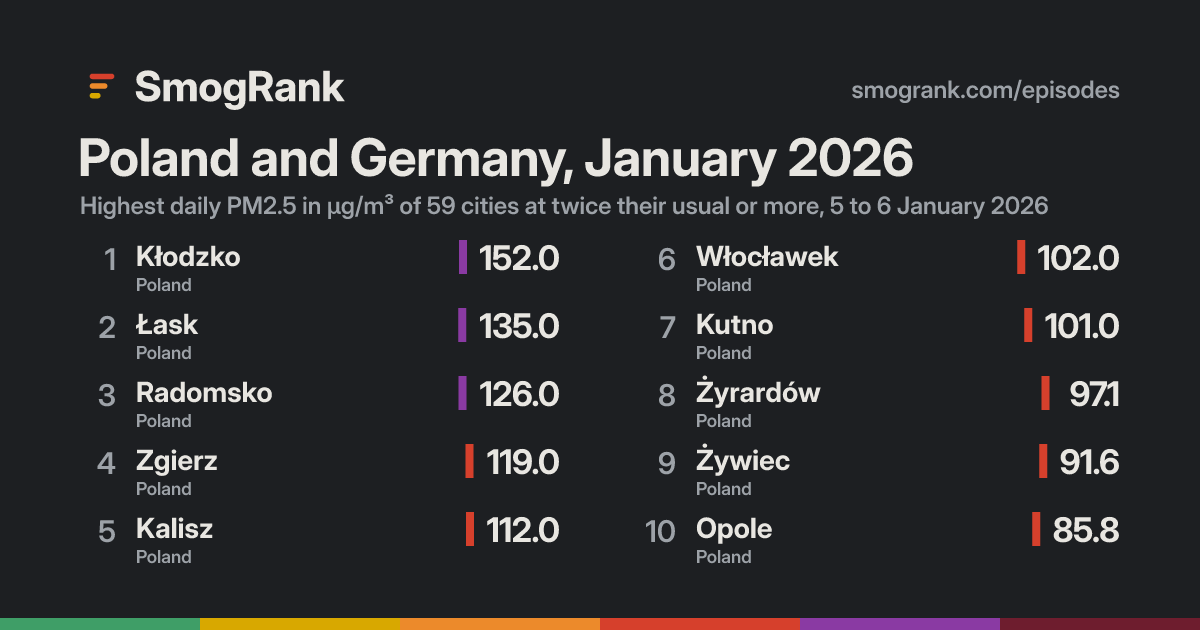
For 2 days, from 5 to 6 January 2026, 59 cities in Poland, Germany and France had PM2.5 at least twice their usual for the time of year. The worst reading was Łask, Łódź Voivodeship, Poland: 135.0 µg/m³ on 6 January, about 5.7× its usual 23.7.
Day by day
How it spread
Every city it reached
| City | Days | Highest | Above usual |
|---|---|---|---|
| KłodzkoLower Silesia, Poland | 2 | 152.09 January | 7.0× |
| ŁaskŁódź Voivodeship, Poland | 1 | 135.06 January | 5.7× |
| RadomskoŁódź Voivodeship, Poland | 2 | 126.06 January | 5.6× |
| KaliszGreater Poland, Poland | 2 | 112.06 January | 5.5× |
| ŻaryLubusz, Poland | 1 | 62.79 January | 5.4× |
| ŻyrardówMazovia, Poland | 1 | 97.16 January | 4.7× |
| BydgoszczKujawsko-Pomorskie, Poland | 1 | 67.16 January | 4.6× |
| KutnoŁódź Voivodeship, Poland | 2 | 101.06 January | 4.5× |
| WłocławekKujawsko-Pomorskie, Poland | 1 | 102.06 January | 4.4× |
| ElblągWarmia-Masuria, Poland | 1 | 66.16 January | 4.3× |
| CiechanówMazovia, Poland | 1 | 83.86 January | 4.1× |
| ZgierzŁódź Voivodeship, Poland | 1 | 119.06 January | 4.1× |
| TarnówLesser Poland, Poland | 1 | 68.39 January | 4.0× |
| WawerMazovia, Poland | 1 | 76.96 January | 4.0× |
| WrocławLower Silesia, Poland | 1 | 74.09 January | 4.0× |
| Konstancin-JeziornaMazovia, Poland | 1 | 72.36 January | 4.0× |
| PoznańGreater Poland, Poland | 1 | 71.36 January | 3.9× |
| Jelenia GóraLower Silesia, Poland | 2 | 64.66 January | 3.9× |
| OpoleOpole Voivodeship, Poland | 1 | 85.89 January | 3.9× |
| ToruńKujawsko-Pomorskie, Poland | 1 | 72.16 January | 3.8× |
| WarsawMazovia, Poland | 1 | 70.86 January | 3.8× |
| PruszkówMazovia, Poland | 1 | 74.06 January | 3.7× |
| Kędzierzyn-KoźleOpole Voivodeship, Poland | 2 | 68.29 January | 3.7× |
| Gorzów WielkopolskiLubusz, Poland | 2 | 54.76 January | 3.6× |
| PłockMazovia, Poland | 1 | 63.66 January | 3.6× |
| LegionowoMazovia, Poland | 2 | 68.86 January | 3.4× |
| OtwockMazovia, Poland | 2 | 82.86 January | 3.3× |
| KościerzynaPomerania, Poland | 1 | 38.46 January | 3.2× |
| KielceŚwiętokrzyskie, Poland | 1 | 62.66 January | 3.2× |
| Czechowice-DziedziceSilesia, Poland | 1 | 61.96 January | 3.2× |
| GdańskPomerania, Poland | 1 | 35.96 January | 3.1× |
| ŁódźŁódź Voivodeship, Poland | 1 | 56.86 January | 3.0× |
| SpeyerRheinland-Pfalz, Germany | 1 | 34.36 January | 3.0× |
| HeidelbergBaden-Wurttemberg, Germany | 1 | 26.36 January | 2.9× |
| Jastrzębie ZdrójSilesia, Poland | 1 | 69.56 January | 2.7× |
| NiskoSubcarpathia, Poland | 1 | 52.16 January | 2.7× |
| Ludwigshafen am RheinRheinland-Pfalz, Germany | 1 | 29.36 January | 2.7× |
| Lauda-KönigshofenBaden-Wurttemberg, Germany | 1 | 27.96 January | 2.7× |
| ŻywiecSilesia, Poland | 2 | 91.69 January | 2.7× |
| WieslochBaden-Wurttemberg, Germany | 1 | 25.06 January | 2.6× |
| PassauBavaria, Germany | 1 | 36.56 January | 2.5× |
| GdyniaPomerania, Poland | 1 | 31.46 January | 2.5× |
| SuwałkiPodlasie, Poland | 1 | 31.25 January | 2.4× |
| BensheimHesse, Germany | 1 | 26.16 January | 2.4× |
| RadomMazovia, Poland | 1 | 49.76 January | 2.3× |
| RzeszówSubcarpathia, Poland | 1 | 45.56 January | 2.3× |
| MannheimBaden-Wurttemberg, Germany | 1 | 27.36 January | 2.3× |
| IngolstadtBavaria, Germany | 1 | 30.46 January | 2.3× |
| AlbertvilleAuvergne-Rhône-Alpes, France | 1 | 25.26 January | 2.3× |
| StarachowiceŚwiętokrzyskie, Poland | 1 | 48.16 January | 2.2× |
| OlpeNorth Rhine-Westphalia, Germany | 1 | 27.46 January | 2.2× |
| MontbéliardBourgogne-Franche-Comté, France | 1 | 31.16 January | 2.2× |
| KrakówLesser Poland, Poland | 1 | 56.46 January | 2.2× |
| LampertheimHesse, Germany | 1 | 25.16 January | 2.2× |
| WormsRheinland-Pfalz, Germany | 1 | 28.56 January | 2.2× |
| JarosławSubcarpathia, Poland | 1 | 38.06 January | 2.0× |
| KatowiceSilesia, Poland | 1 | 47.76 January | 2.0× |
| AugustówPodlasie, Poland | 1 | 41.96 January | 2.0× |
| EłkWarmia-Masuria, Poland | 1 | 27.16 January | 2.0× |
Daily means in µg/m³. Usual: the city's median for this time of year (its days within 21 days of the date, every year, leaving out the week around it). Above usual: its highest day against that.
Against other episodes in Poland and Germany
Number 18 of 42 episodes in Poland and Germany since our records began, by cities reached.
- Central Europe, February 2023604
- Central Europe, February and March 2025513
- Central Europe, February 2025503
- Central Europe, January and February 2026498
- Central Europe, March 2025458
- Central Europe, March 2026442
- Central Europe, January 2025383
- Central Europe, March 2026361
- Central Europe, March 2025333
- Central Europe, December 2025 to January 2026170
- Eastern Europe, January 2025123
- Eastern Europe, December 2025118
- Poland and Germany, January 202659
Bars: cities reached; colour: the level of the episode's highest daily reading. All 42.
Use this page
SmogRank, Poland and Germany, January 2026: 59 cities with PM2.5 at twice their usual or more, 5 to 6 January 2026, smogrank.com/episodes/2026-01-poland-and-germany (accessed 2 October 2026).
You're welcome to reuse a single chart, image or figure with this citation and a link. Terms.
An episode is a run of days when many cities close to each other (four or more within 350 km on a day, 8 or more in all) each had a daily PM2.5 mean of at least 25 µg/m³ and at least 2 times their usual for that time of year. Found in our own measurements, not picked by hand. How we find episodes. Values are each city's daily mean of its own monitors; causes are the usual kinds for a pattern like this, not a confirmed source.